AY
Hi,
I'm a full novice at ARIS, so I wonder if I can use it to perform the following tasks:
- Create a diagram describing flows of fin. messages inside a bank, between backend systems, gateways, messaging hubs etc, via different transport (MQ, Kafka, TCP sockets, file exchange etc)
- Create custom attributes for shapes and connectors, so that I can specify server names/IPs, backend systems' details, queue details, file directories' details, types and formats of messages being transferred etc etc etc
- Create shapes describing routing, filtering, transformation and validation of messages
- Mark all shapes and connectors with "tags", and be able to select tags so that only shapes/connectors marked with these selected tags are currently visible (e.g. by means of "layers")
- Associate misc. resources with shapes/connectors/tags (file paths, http URLs etc)
- Be able to store the diagram in a source control system
- Be able to create a custom plugin to generate documentation (with the desired content structure and formatting) from the diagram
Is it possible with ARIS?
Hello,
1. Have you taken a look at the Open Group Archimate 3.0 standard notation, if you find a mapping of your concepts to that? ARIS supports Archimate 3.0 notation and you can define your own Archimate viewpoints. Also BPMN 2.0 notation is supported, so BPMN 2.0 Collaboration could cover some aspects of your requirements where Archimate is too high-level.
2. You can define as many attribute types as you want.
3. ARIS is not about shapes, but objects. First you should identify which object type your concepts map to best. Then if you don't find a suitable symbol in that object type you can derive a new symbol for that object type to show the concept you want to depict.
4. There are highlighting features in ARIS Connect. That way things not meeting the criteria would become pale grey. Or you could create derived views through reports.
5. You can add Link attributes to any object and even show such links with a human-readable link caption in your model diagrams.
6. ARIS has got its own repository. If you want to preserve historical states you can make snapshots of model diagrams (aka versions). You can compare current state with historical snapshots and show the differences in any attribute of any object in the diagram. Also you can compare historical states with each other. If you want to store it in some external git, svn or the like I would not know what you could sensibly store there - the model graphic? It is possible to export the model graphic, e. g. in PNG format, but that's probably not what you want.
7. ARIS has reporting features. You can output any repository content in doc, docx, xls, pdf, rtf, odt format. If you have special requirements you can access all content via an API in Javascript and write your own reports and output any format, such as XML.
Please also note, that ARIS is available with a full UML 2.5/XMI 2.1 compliant modelling environment that is integrated with all the well-known ARIS modelling features.
Thank you very much for the detailed answer!
Several comments/questions:
1. Why do I need to use some "notation" if all I need is a set of 10-12 rectangle shapes and 5-6 arrowed connectors?
3. Ideally, I would not care which of the standard objects maps best - I'd better create my own from scratch (Messaging Hub, Gateway, Message Flow etc), if possible. And my own shapes for them as well (rectangles and arrows).
4. Pale grey is also fine ) UPD: just noticed that you mentioned "ARIS Connect". Does it mean that to use highlighting feature I need to install and use a separate software?! And one question more: will it be possible to select several tags (not one) so that only shapes/connectors marked with any of these tags remain black (and others become grey)?
6. Other diagram software I used before stores its diagrams in an XML-based format, so there's no any problem to store diagrams in source control systems. And of course I'm not thinking about storing PNG )
7. Not sure that built-in reporting features provide the necessary flexibility; need to investigate them first. BTW, is JavaScript the only choice for API?
Hi Alexey,
just noticed your edit: ARIS Connect is the web client of ARIS (based on HTML 5 technology). It works with the same repository as the Java rich clients "ARIS Architect/Designer" and "ARIS UML Designer". Using Connect requires separate licenses from the rich clients. If you are using the offering from ariscloud.com it is effectively the ARIS Connect product you are using.
If your company is not using ARIS in the flavour "ARIS Design Server" (which is on the maintenance path from ARIS 7.2) they will most likely have the ARIS Connect Server, which can serve both types of clients. Then it is only a question of which client licenses were purchased. You can even use both types of clients in the same environment. It's a question of what the target groups prefer and which users need advanced features available only in ARIS Architect.
Hello Alexey,
Let me make something very clear: ARIS is not a diagram software. It is a modelling platform.
Answer yourself just one question: Do you want to draw squares and rectangles on (electronic) paper or do you want to manage the IT infrastructure of a bank? You are asking about defining shapes for drawings. I answered, you can define symbols for object types.
What's the difference? Imagine you visit a Legoland (TM) resort (I do not endorse doing that, but I assume that brand has enough fame to illustrate my example globally). You take pictures of the zoo of Lego animals with your camera. Two weeks later you meet a friend and you show him your pictures. He answers he was there the day before and took some pictures. It was Halloween season in the meantime and the zoo was inhabited additionally by lots of creepy creatures and stables covered in cobwebs and the (Lego) animal nurses suddenly had pointy vampire teeth.
Now will you go there again and make new photos? Or will you want to place a webcam at every angle so you can observe live what is going on?
Now suppose this scenery of Legoland were just a planning tool for a 3D movie where real (or animated) actors will do the things shown there by the Lego puppets.
You use this scenery for planning your camera angles, planning the feasibility of the action.
To be able to use this type of scenario you have to do a little planning. You have to decide on the types of Lego bricks (objects) you want to use that will represent the "things" to be seen in the movie and how these bricks interact (e.g. a network interface x.y.z.5 is connected to a network segment x.y.z.0/255)
The object types in your case are interfaces, routers, nodes, messages, applications, network segments... everything you mentioned.
If you change an attribute of a single brick, e.g. the IP address of a "thing", this new IP address will be visible from any camera angle (diagram), at least if that particular camera (diagram) is interested in that detail.
So the 3D Lego model is the single point of truth that you use to manage the creation of your movie (The Bank).
The camera angles (diagrams) are just views on that single point of truth to show every detail that is required to produce the movie. (It is a lot less than the movie itself.)
If someone finds a detail from his point of view (camera/diagram) that needs improving, he will modify the Lego scenery and this will be reflected in every view showing that detail or report using that detail.
ARIS can also support the coordination of multiple stakeholders to reach approval on the model changes.
In this sense "reporting" is nothing but the creation of other views for stakeholders that do not actively interact with the scenery, but need specialized points of views.
Why do you need a notation? Of course you can re-invent the wheel and define some pictograms for yourself. I personally doubt that this effort will add value to your organization.
If you take a look at Archimate or any other framework you will find a lot of experience (designs of Lego bricks) there. The actual symbols are irrelevant. It's about the concepts they represent. If you don't use a notation, you do everything from clay. And if you do not use modelling, but a drawing tool your bank is paying an artist for paintings, not even sculptures.
I hope I could convey the idea of what ARIS does for organizations. It is that 3D scenery with all the Lego bricks assembled and webcam camera angles you choose, hence always up-to-date views. If you want you can even compare that camera angle with the corresponding scene from the movie (dashboards of live data). It's a bit like augmented reality.
Now particularly for the purposes of documenting and maintaining your Enterprise Architecture in a bank with probably thousands of applications, message types, systems... you may want to consider some tool with an out-of-the-box metamodel, that simply provides the bricks and the patterns how to combine them usefully. For the usefulness you would have to make design decisions in ARIS.
You could take ALFABET into consideration. It is more data driven than ARIS and very strong on reporting for the Enterprise Architecture purposes and it is also built on a proven EA methodology.
Thank you for explanation )
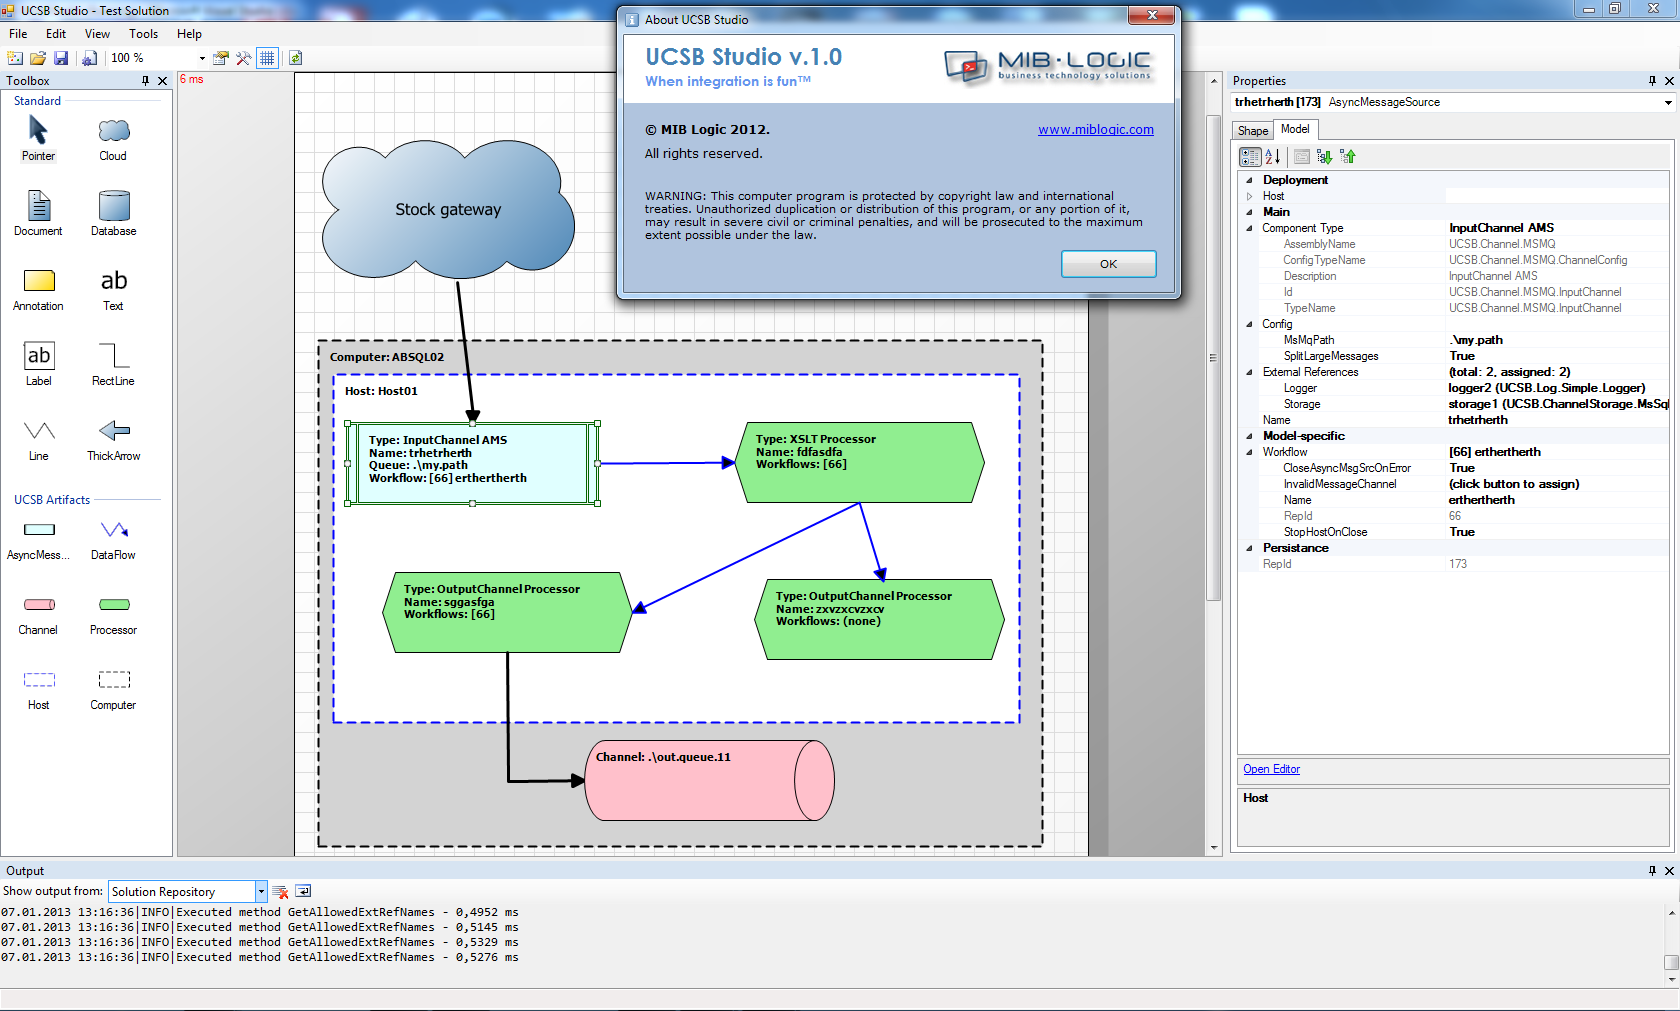
I fully understand difference between shape and model. Years ago I developed a diagramming tool with distinct separation of these concerns - see the attached image file (tabs "Shape" and "Model" in the Property browser). It was a simple and lightweight solution, based on an open-source project (NShape Framework), and I could easily perform any level of customization. It took minutes to create a custom model or a custom shape - so easy that nobody would ever call it "re-inventing a wheel"; I didn't care about any notations.
Unfortunately I'm forced to use ARIS now - because it's a standard in our bank.


