After the first successful initiative in the area of report and macro scripting in ARIS, I have started a new tutorial initiative on how to create your own reports with the WYSIWYG (What You See Is What You Get) editor in ARIS.
In the coming articles you can learn some interesting facts about how to develop scripts in ARIS with the WYSIWYG editor.
In this post, I will just list the links to the published articles. I will not post the articles to the blog, because people might not be interested in this subject. Instead, the articles are posted to the "Reports & Macros in ARIS" group within ARIS Community. You can subscribe to the feed of this group or visit this post from time to time to get updated on the latest features.
Here is a list of tutorials, which I already published as part of my tutorial. Please let me know if I should cover additional aspects of the WYSIWYG reporting editor in ARIS.
I am completely new to the ARIS platform (we are actually using ORACLE BPA suite powered by ARIS) and I am looking for a more complete guide to creating reports using the wizard as I have no scripting knowledge.
I have not clearly undestood the meaning of the sections and when I should insert a query or a data table and so on. I did go through your previous guides but a little more help would be much appreciated. I am the most expert team member on using ARIS for process modeling but I have no experience on report creation. The other team members rely on me. Please help me out.
the WYSIWYG editor supports people without programming knowledge, but you need some knowledge about the ARIS method. In the near future I will try to post some other tutorials on this subject to help people find their way to the report world of ARIS :).
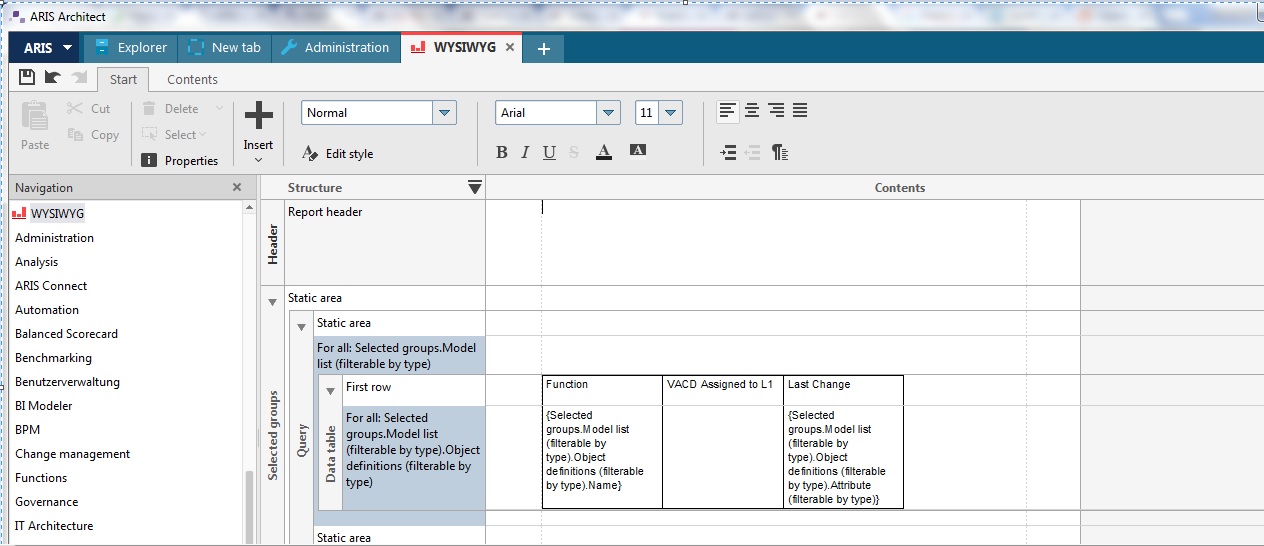
Sections are the structal elements of every report script template. In sections you define your data by queries, which should be anaylzed. You also define the layout of your report in sections, for example, the title.
Please see this article: the screenshot also includes the description of the sections.
Regards
Yes, for those like me who accurately avoid programming..... Insert a query in a section "object occurrances filterable by type", then specify the object of the model (in my case in "function" because I need to describe "who make what" in the process), and then ....... very important set the parameter "sort" using Coordinate Y and Coordinate X. That means that the query works like a scanner starting from top to down but, if there´s a parallel objet then, "switch right" before going furher down till the end...
Of course in this solution you need to establish a specific object as the "one who command" in leading the query..
I have gone through the 5 links provided by you on WYSIWYG. Very helpful. I have to create a report where in addition to showing the EPC graphic and the table with all the function/event names and their object type and description i also need to show in the same report the FAD graphics that are present for any of the functions of the EPC and show thier details. How could i do the same? woud be helpful if you can take me through with screen shots.


.jpg)


