Second Act: My first Mashapp
Today I would like to tell you how I created my first MashApp. I thought about creating some sort of financial MashApp and decided to visualize my weekly food expenses. The excel file I used and the Mashapp I created are attached below.
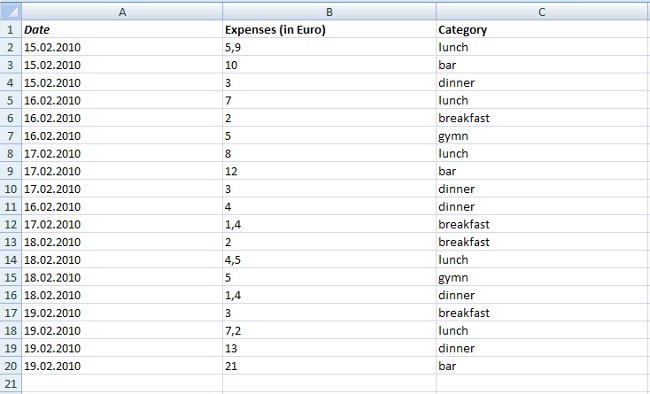
First of all I created a simple excel file that contains all my expenses that have anything to do with food.
I started MashZone. Then I created the following operators: a selection box, a column chart, a pie chart and a textfield. Then I saved my MashApp.
.jpg)
I clicked on “Assign data” in the selection box. After that I created a new data feed. I used my excel file as data source and connected it with the output operator.
.jpg)
Then I saved my data feed and I went back to the composer/assign data section. I connected the category column with the selection box.
.jpg)
Afterwards I assigned data to the column chart. I selected the same data feed I created before and connected the columns “date” and “expenses” with the column chart. Accordingly I clicked on “sum” to show the sum of the expenses in the column chart.

To connect the column chart with the selection box I clicked on "filter data". Then I selected the selection box and the data feed column “category” and set the condition to “is equal to category”. After that I applied the filter and went back to the composer.

Now it was possible to control the column chart with the selection box. To get a better view over all my weekly expenses I added a new Entry “No selection” to the settings of the selection box.

Afterwards I assigned data to the pie chart like I did it before with the column chart. (assign data/select the saved data feed/connect columns “category” and “expenses” with the pie chart/select sum) Then I clicked on filter data. But this time I filtered the pie chart with the column chart by date!

Then I just assigned data to the textfield and connect it with the selection box to get the expenses at a glance. I just did some small layout changes and I had finished my first MashApp.
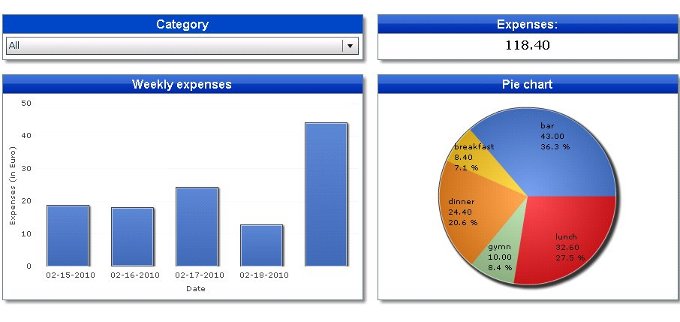
After visualizing, and analyzing my weekly expenses, I realized that I definitely do not spend enough time in my favorite bar :)
Perhaps you’ll also gain interesting insights to improve your life…And all you need to get this done is -you know it …....MashZone!
More information and interesting video tutorials can be found here.
To be continued.
Cheers,
Martin