Welcome back to the blog series about the implementation of the new dashboard for application portfolio management. In the last blog post we set the goals for the dashboard and defined the charts to be contained. Now we’ll get the necessary data out of the ARIS repository.
Typically, this is done by means of reports or queries. Since the calculation of the KPIs we defined requires some logic, we decided to use reports which are more versatile in this regard than queries.
I’ll describe these reports from a conceptual point of view. In two annexes I’ll also show parts of their source code in the hope that it inspires some of you to write your own reports for your own dashboard projects.
OK, let’s get to it.
First we had to determine what data was needed exactly for the different charts in the dashboard. Here is the screenshot of the dashboard from the first blog post again for reference.
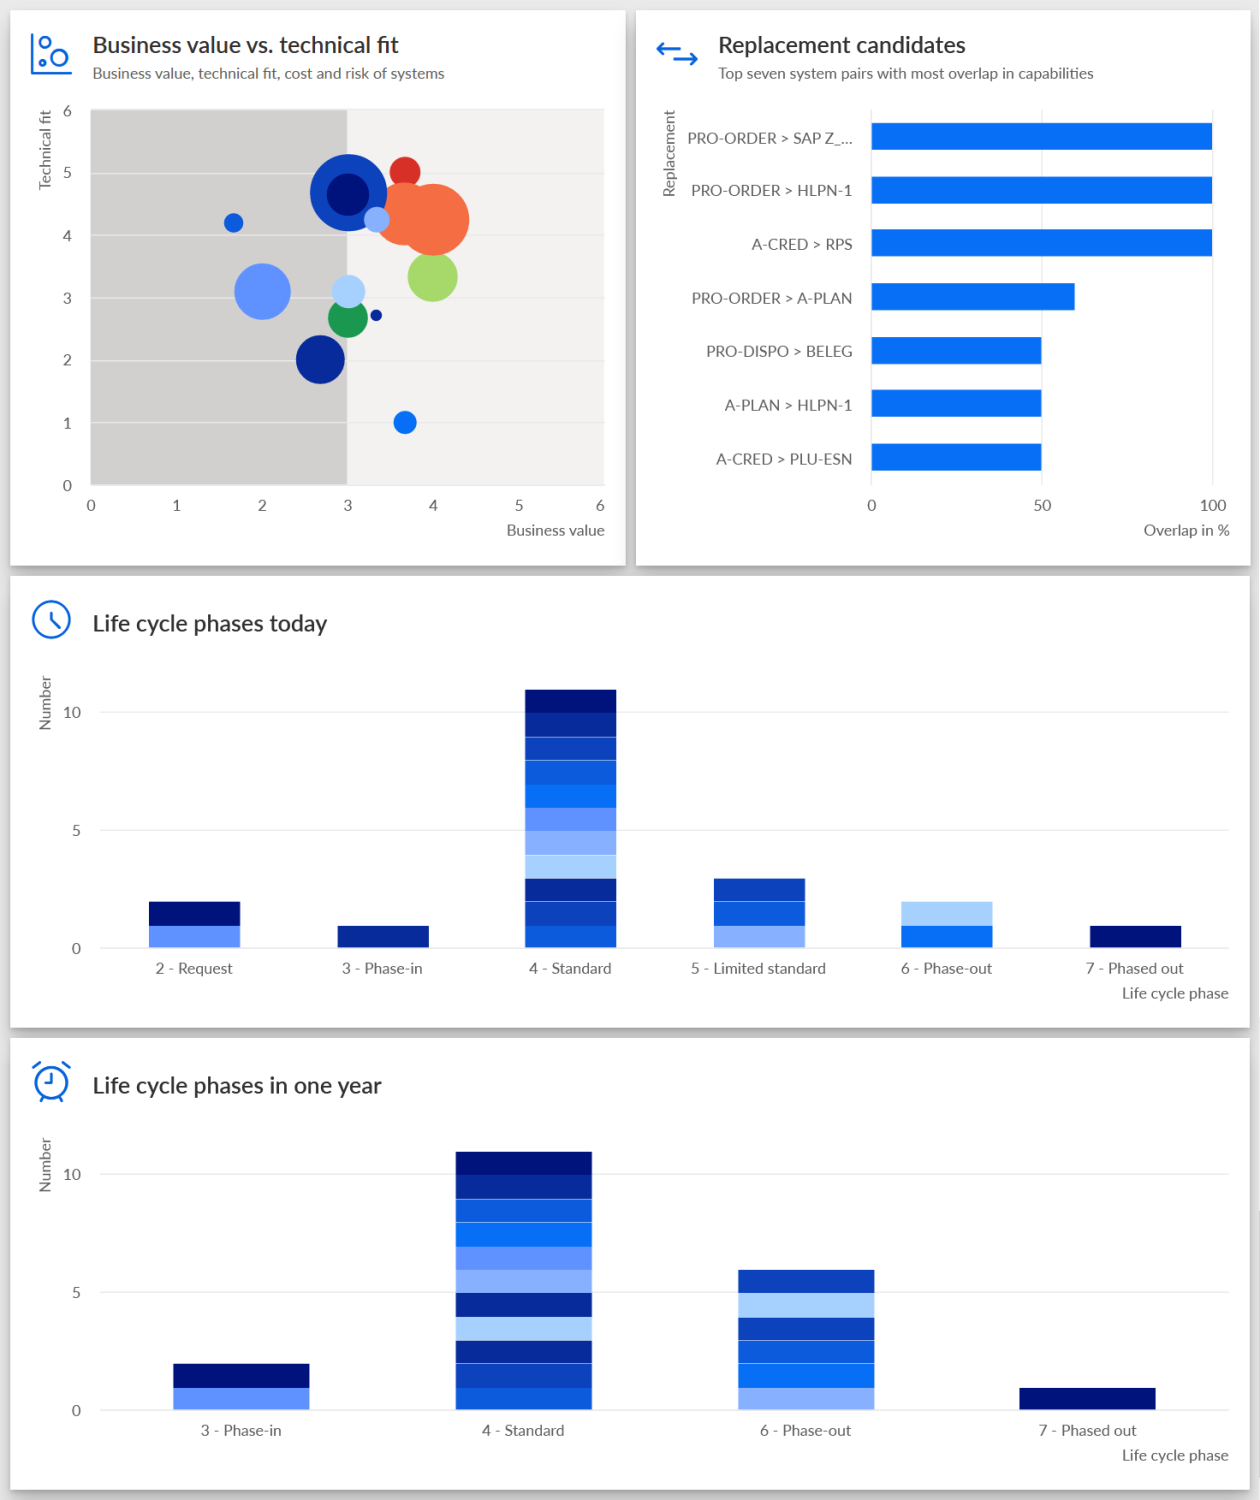
There are four charts: the portfolio diagram with KPIs for business value, technical fit and others, the bar chart with pairs of application replacement candidates and two histograms with lifecycle information.
When the dashboard was conceived, there were already reports available that generate data for the charts with the application replacement candidates and the lifecycle phases because this information is also used in EA dashboards for organizational units and applications. There was also already a report that calculated other types of information for applications. So we simply had to extend this report to include the data required for the four-quadrant portfolio. I’ll describe the changes to this report first.
The report just mentioned produces data for all applications in the database, but for our dashboard we needed to filter out the data sets related to the applications in the diagram that acts as the context of the dashboard. Therefore we required a new report that would produce a table with associations between diagrams and applications. This is the second report I’ll be describing.
The name of the first report is EA - Systems with data. It is installed by default and you can find it in the report category Dashboard data. It is locked, though. If you want to look at its source code, you can get an unlocked version from the ARIS installation media.
The purpose of this report is to create a table of all applications in the database with some properties we are interested in. The report then uploads this table in the form of an XML file to ARIS Document Storage (ADS) where it can be accessed by data feeds or by dashboards directly.
The following application properties were already calculated by the report in SR17: data center costs, criticality, and interface count. Let’s look at the application portfolio diagram in detail to see what was needed in addition.
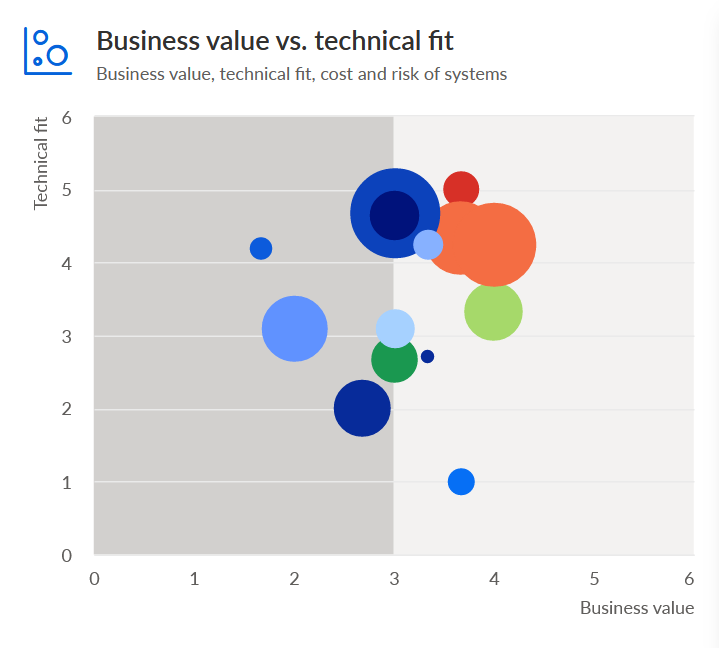
The portfolio diagram has four dimensions: technical fit (y-axis), business value (x-axis), risk (bubble color), and cost (bubble size). For cost we could simply use the existing data center cost property. But for the other ones we needed new properties and calculations:
- Technical fit: We decided to use the average standardization status across all components of an application as a measure for technical fit. It should be a value between 1 (very poor) and 5 (very good). In order to calculate it, the report would need to iterate over all components of an application and sum up values representing the standardization states of them. These values would also range from 1 to 5. For example, a component that is in evaluation would get a value of 1, one that is standard a 5 and one that is to be phased out a 2. From this sum an average would be calculated and assigned to the application.
- Business value: For the business value we decided to compose it from several measures: application criticality, number of users, and number of supported activities. The business value would be an average of these three measures, all of which would have values between 1 and 5:
- The (numeric) criticality was derived from the Criticality attribute of an application which can have values between very low (1) and very high (5). There was already a function to calculate this in SR17.
- The users score would depend on the values of the attributes Number of internal users and Number of external users. The report would calculate a sum of these values and define threshold values for translating user counts to a score between 1 and 5.
- The supported activities score would be derived from the number of activities to which an application is connected with relationships of type supports. Here we also defined threshold values in order to get scores between 1 and 5.
- Risk: The risk score of an application would be calculated as the maximum risk score across all risks that are connected to it. The score for one risk is calculated by adding the value of the Reduced Occurrence Frequency attribute to the value of the Reduced Amount of Damages attribute. Each of these qualitative assessment attributes can have five states which are given numbers from 1 (very low) to 5 (very high). Thus, the risk score can range from 2 to 10.
So much for the conceptual description of the KPI calculation. In case you are interested in how some of these calculations have actually been implemented, please have a look at annex 1 below where you can find parts of the report’s source code and some explanatory comments.
The second report is supposed to tell us which applications are contained in which diagrams of a specific type. We decided to name it EA - Models and systems. This report can also be found in the Dashboard data report category or as an unlocked variant on the ARIS installation media.
The output of the report would be a table where the first column contains IDs of diagrams and the second column IDs of objects that are contained in them. Each row consists of one diagram and one object ID. In order to achieve this the report would find all diagrams of type Application System Type Diagram in the database, iterate over the contained objects of type Application System Type and for each of them write a row into the table with the respective diagram and object ID.
The implementation of this report including some source code is described in annex 2.
Besides the logic for building the data tables, we also had to tell the reports where to put the respective XML files in ADS and how to name them. This was done by setting so-called report parameters. ARIS Architect provides a dialog for this which can be opened with the action Edit report parameters. Here is a screenshot of this dialog with the parameters of the EA - Models and systems report.
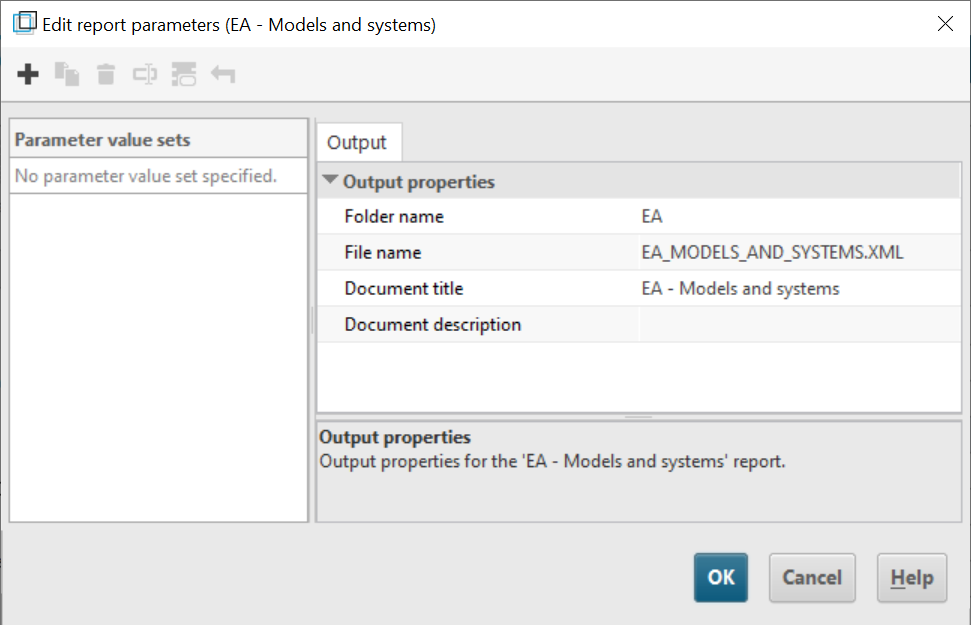
You can specify a folder name, a file name, a document title, and a document description. In ADS the folder will be put into a folder for the database on which the report is run and this in turn into a folder called “Dashboarding”.
For the EA - Models and systems report we set the file name to “EA_MODELS_AND_SYSTEMS.XML” and for the EA - Systems with data report to “EA_SYSTEMS_WITH_DATA.XML”. Both files will be put into the folder “Dashboarding/<database>/EA”. (Note: Don’t be surprised to find an additional file with metadata for each file with data in ADS. The reports produce these automatically.)
These two files are the data sources for the application portfolio shown above. For the other charts in the dashboard which are concerned with application redundancy and lifecycle states there were already reports that produce the necessary data. In the next blog post we’ll look at how all these files are used by data feeds which prepare the data for consumption by the charts in the dashboard.
Thanks for reading and see you next time.
Annex 1: Implementation of report EA - Systems with data
In this annex you can get an insight into the source code of the report EA - Systems with data and how it was changed to calculate the new KPIs described above.
The report calls three major functions:
outHeader();
main();
uploadXmlOutputToADS(output, outputParameters);
outHeader() creates the column headings of the data table that is produced by the report. main() collects the data from the repository and adds it to the table. uploadXmlOutputToADS() finally uploads the table as two XML files to ADS. (Note: outputParameters contains the parameters defined through Edit report parameters as described above.)
In SR17 the outHeader() function looked like this:
function outHeader() {
   output.setColumns([["System", "text"],
                      ["System-Guid", "text"],
                      ["Data center costs", "number"],
                      ["Criticality", "text"],
                      ["Criticality (numeric)", "number"],
                      ["Interface count", "number"]]);
}
So the table contained columns for application name, application ID, costs, criticality as text, criticality as a number, and interface count. We extended it by adding columns for the new KPIs: technical fit, business value, and risk. The new outHeader() function in SR18 now looks like this:
function outHeader() {
   output.setColumns([["System", "text"],
                      ["System-Guid", "text"],
                      ["Data center costs", "number"],
                      ["Criticality", "text"],
                      ["Criticality (numeric)", "number"],
                      ["Interface count", "number"],
                      ["Technical fit", "number"],
                      ["Business value", "number"],
                      ["Risk score", "number"]]);
}
The values for technical fit, business value, and risk score are calculated by dedicated functions that are called in main(). Here is what main() looks like:
function main() {
    var oSystems = g_oDB.Find(Constants.SEARCH_OBJDEF, [Constants.OT_APPL_SYS_TYPE]);
    for (var i in oSystems) {
        outArisAttributes(oSystems[i]);
    }
}
The function simply finds all applications in the database and writes out a row of attributes for each by calling outArisAttributes(). This function, in turn, calls a function for each attribute. outArisAttributes() already existed in SR17, so we simply needed to add the function calls to determine the new KPIs, similar to what we did with outHeader(). This is what the function now looks like in SR18:
function outArisAttributes(oSystem) {
    output.addRow([oSystem.Name(g_nLoc),
                   oSystem.GUID(),
                   getMeasureValue(Constants.AT_COST_COMP_CNT), // Data center costs
                   getValue(Constants.AT_CRITICALITY), // Criticality
                   getNumericCriticality(), // Criticality (numeric)
                   getInterfaceCount(oSystem), // Interface count
                   getTechnicalFit(), // Technical fit
                   getBusinessValue(), // Business value
                   getRiskScore()] // Risk score
                   );
…
Now the fun part started: implementing the new functions for technical fit, business value and risk score. I won’t show you all of them because this would be too much for this blog post. (I’ve been told it is already too long as is.) We’ll only look into how the business value is calculated and here in particular its score for supported functions.
As mentioned above, the business value is an average of scores for criticality, number of users and number of supported activities. This is how its calculation was implemented:
function getBusinessValue() {
    var result = "";
    var critScore = getNumericCriticality();
    var usersScore = getUsersScore();
    var suppFuncsScore = getSuppFuncsScore();
    if (critScore != "" && usersScore != "") {
        result = Math.round((critScore + usersScore + suppFuncsScore) * 100 / 3) / 100;
    }
    return result;
}
For each sub-KPI a dedicated function is called before an average is calculated in the second to last line. For the number of supported activities it is getSuppFuncsScore(). Here is its code:
function getSuppFuncsScore() {
    var result = 1;
    var aoSuppFuncs = oSystem.getConnectedObjs([Constants.OT_FUNC], Constants.EDGES_OUT, [Constants.CT_CAN_SUPP_1]);
    if (aoSuppFuncs.length > 1000) {
        result = 5;
    } else if (aoSuppFuncs.length > 100) {
        result = 4;
    } else if (aoSuppFuncs.length > 10) {
        result = 3;
    } else if (aoSuppFuncs.length > 0) {
        result = 2;
    }
    return result;
}
The function determines the activities that are connected to the application with a relationship of type supports (CT_CAN_SUPP_1). If there are more than 1,000, a value of 5 is returned, if there are more than 100 but less than 1000, a value of 4, and so on. By default, a score of 1 is used. That’s it.
If you want to know how the other functions are implemented, I encourage you to look into the source code of the report. Let me know in the comments if you have any questions.
Annex 2: Implementation of report EA - Models and systems
In this annex you can get an insight into the source code of the new report EA - Models and systems.
This report, too, calls the three functions outHeader(), main() and uploadXmlOutputToAds(). This is the outHeader() function to produce the header:
function outHeader() {
   output.setColumns([["Model GUID", "text"],
                      ["Object GUID", "text"]]);
}
This is analogous to the other report but with less entries. This one has just two columns, one for the model ID and one for the object ID.
Now we look at the implementation of main():
function main() {
    var oModelList = oDB.Find(Constants.SEARCH_MODEL, [Constants.MT_APPL_SYS_TYPE_DGM]);
    for (var i in oModelList) {
        var oModel = oModelList[i];
        var oObjList = oModel.ObjDefListByTypes([Constants.OT_APPL_SYS_TYPE]);
        for (var j in oObjList) {
            var oObj = oObjList[j];
            outRow(oModel, oObj);
        }
    }
}
The function finds all Application System Type Diagram models (MT_APPL_SYS_TYPE_DGM) in the database and iterates over all Application System Type objects (OT_APPL_SYS_TYPE) in them. For each of those it generates a row in the result table by calling outRow().
The outRow() function is pretty straightforward. It simply determines the ID of the model and the object it is given and puts them in an array for the addRow() function:
function outRow(oModel, oObj) {
    output.addRow([oModel.GUID(), // Model GUID
                   oObj.GUID() // Objective GUID
                   ]);
}
And that’s it.
This report is simpler than EA - Systems with data. You might still want to have a look at it to check out all the details I’ve omitted in this blog post. Again, if you have questions, I’ll be happy to answer them in the comments.