
Since yesterday MashZone 2.0 is officially available. Christian already illustrated that Google Maps™ has become an all new widget. With maps you can visualize your key performance indicators (KPIs) where they actually had been measured. In any place on the world. Everywhere.
You can color the points of interest reflecting threshold values or goal accomplishments right within the map. And you can even interact with the map, i.e. your KPIs directly.
MashZone and Google Maps™ requires Professional Edition at least. And you must accept Google's terms of service (ToS). However, MashZone 2.0 supports another kind of maps, too. Although not that flexible if compared with Google our vector maps might be a valid option in many cases.
Yvonne explained that vector maps became customizable. She demonstrated how any shape could be shown and colored by MashZone. In contrast to Google Maps which focuses on points of interest MashZone vector maps shows regions where each is reflected by a polygon.
So in this article I want to present a how-to which enables you to create your very own vector map in MashZone.

http://es.wikipedia.org/wiki/Archivo:Par_Arr.svg
This is an image, i.e. a bitmap, and to make it properly useable in MashZone we need to extract the different areas out of it. But as nobody wants to draw lines again we will make use of a cool feature which ships with the OpenSource application Inkscape for free. In the rest of the article I will explain everything step by step.
First launch Inkscape and import the bitmap. The approach works best with images with few colors and clear edges.

Now that the image has been imported move it to the upper left corner and invoke Trace Bitmap... to detect polygons within the bitmap automatically. For those of you not being familiar with tracing: There is a good tutorial video by Adobe hosted on YouTube. Although it covers the commercial alternative to Inkscape you should get the idea.

Trace the image using such settings - adapt them to your image's best fit:
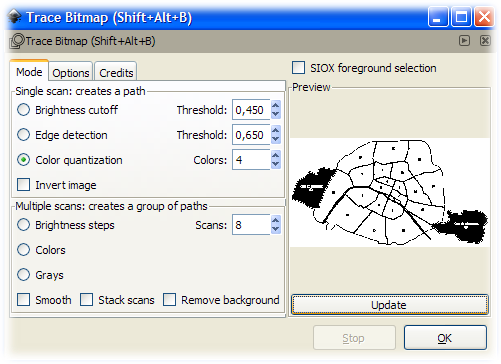
Now within Inkscape we have an image and a group of polygons according to colors and edges. As we don't need the image any more, remove it. In the next step we use the Path Break Apart... feature to convert many polygons into one per arrondissement. This should result in 20 boxes each bounding one arrondissement.

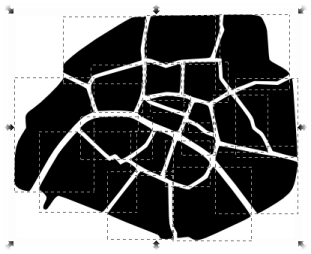
Now we need to name each of them to be identified by MashZone later. Paths in Inkscape might have attributes, we use the id-attribute and fill it with the arrondissement's number. Select one of the regions detected automatically and enter the identifier.


After you've done this for all 20 arrondissements hit save and there is a SVG file on your hard disk. Unfortunately you need to transform this into MashZone's proprietary XML-dialect. But as SVG is an XML dialect, too, there is a little XLS script attached to this article. It is named svg2mashzone.xsland handles all the conversion stuff. Feel free to reuse it for any map, on your own risk of course.
Based on the results I created a litte MashApp where each arrondissement is colored according to the population's density. Wikipedia publishes the numbers, already. Hit the image's link to see the MashApp in action.
Of course you can download and reuse everything on your own, all you need has been attached to this article.
Note: See this post for a list of other articles about MashZone 2.0. You might be also interested to join the ARIS MashZone group at ARIS Community.


Hi Stephan,
I am making progress but now I realise that the XSL proposed is not a generic xsl, it is dedicated to the "arrondissement de Paris".
For instance, it contains :
<xsl:value-of select="'France - Paris'" />
What should be done in order to make this work for my own maps ? I guess I should modify the XSL each time ? Any clue ?
Thank you in advance for your support
Laurent
I, see. 'France - Paris' is hardcoded. Feel free to replace it with your own name. The value will populate the combo box in MashZone once a user selects the map. So I suggest to replace
<xsl:value-of select="'France - Paris'" /> by
<xsl:value-of select="'Belgium'" />. The xsl is basically a plain text file so changing it should be easy.
.PNG)
I investigate and I think I understand where the problem is coming from.
I am not working on a map but on another graphic. The automatic recognition from inkscape was not working, so I draw the map myself with rectangles.
Unfortunately, this xsl only works for "path" polygon and not with "rect" polygon. Can you provide another xsl that can do the job or I am on my own ?
Thank you in advance for your help.
Laurent
Extract from the svg :
<rect style="fill:#0000ff;fill-rule:evenodd;stroke:#000000;stroke-width:1px;stroke-linecap:butt;stroke-linejoin:miter;stroke-opacity:1" id="F1" width="142.58504" height="75.102043" x="-154.55782" y="596.30774" inkscape:label="#rect6098" />
<rect style="fill:#0000ff;fill-rule:evenodd;stroke:#000000;stroke-width:1px;stroke-linecap:butt;stroke-linejoin:miter;stroke-opacity:1" id="F2" width="141.4966" height="75.102043" x="-154.55782" y="682.29413" inkscape:label="#rect6100" />
.PNG)


