PV
iI'm trying to use a 'date' value in a KPI widget in Mashzone.
I've found this as an obstacle a number of times in the past, but always found my way around it - alternative approach based on the use case I'm working..
In my latest case, I have not been able to find a suitable workaround so turning to the community / support.group for ideas.
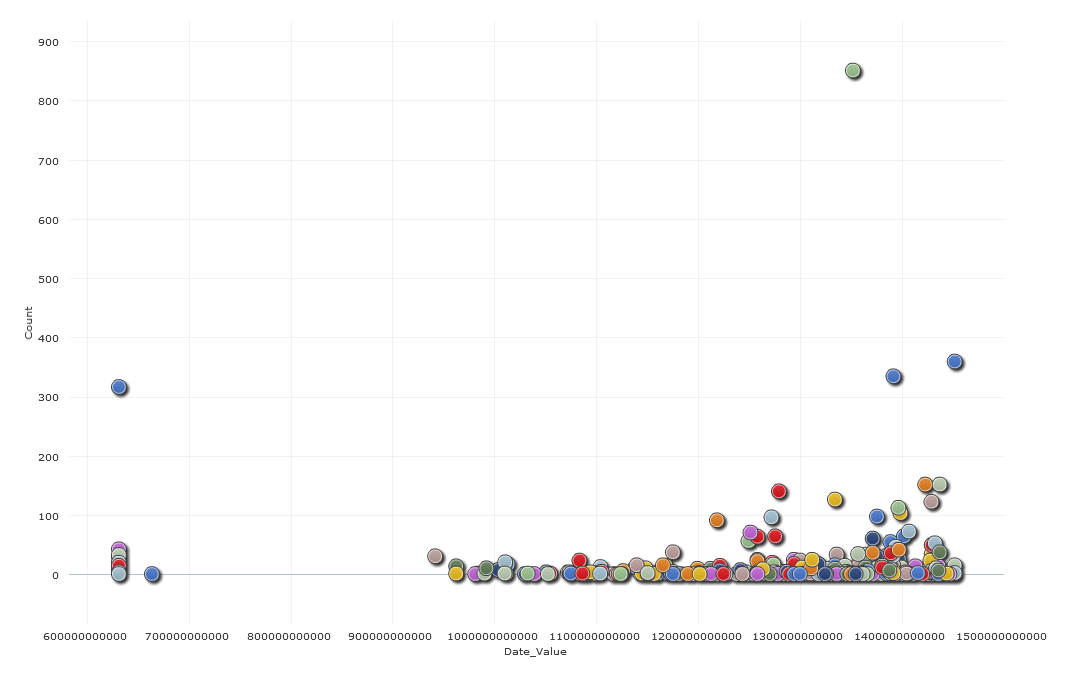
Scenario: As of today I'm trying to define a bubble chart. A bubble chart supports up to 3 KPIs (2 of which are required, 1 being optional).
The KPIs for my chart are as follows
X-axis = Date
Y-axis = Count
Radius = unassigned
My issue is Mashzone won't allow me to assign a date as a KPI and as such I can't use Dates to set the scale (e.g. my goal is to render the # of a topic events (count) along a timescale". It seems the rendering engine isn't smart enough to recognize that dates are infact numerics and should be allowed as KPIs (or maybe a better way of saying it is scales don't necessarily have to be KPIs but of course they do need to be numeric)
So what I find myself having to do is convert any date values into numbers within the datafeed and then use that number value to set the scale. Of course then I find the second limitation where as Mashzone doesn't provide any date formatting for the scale only generic numeric formats. So what I end up with is a chart with a bunch of numbers for a date scale that no human can connect with. In my case the starting date is 1/1/1990 and ending date is 12/31/2015 but the scale reads "6000000000" to "150000000000" (number of zeros may be off as I didn't count them but you get the idea....)
Any alternative approaches for dealing with date scales as KPIs in Mashzone
See attached


